Status
Reference material for status.
/portal/status/active-calls
Live and recent system metrics.
| Sub-page | URL | Purpose |
|---|---|---|
| Active calls | /portal/status/active-calls | Live view of calls in progress. |
| Registrations | /portal/status/registrations | SIP devices and mobile apps currently registered. |
| Graphs | /portal/status/graphs | 24-hour rolling view of call volume, registrations, and quality. |
| Recorded calls | /portal/status/recorded-calls | Every recorded call with playback, transcript, notes. |
| Call Log | /portal/status/call-logs | Every call placed on the tenant, newest first. |
Active calls
| Element | What it shows |
|---|---|
| Title | Active calls. |
| Subtitle | "Live view of calls currently in progress on this tenant. Auto-refreshes every 5 seconds." |
| Filter | Search by name, extension, trunk, state. |
| UPDATED label | Seconds since the last refresh. |
| Header | "{N} calls in progress" with auto-refresh cadence. |
| Table | START · FROM · TO · TRUNK · ACCOUNT · STATE. |
| Empty state | "No calls currently in progress." |
 Active calls — 0 in progress with the empty-state card.
Registrations
SIP devices and mobile apps currently registered to this tenant. Token registrations come from push-enabled mobile clients (no contact URI).
| Element | What it shows |
|---|---|
| Filter | Filter by extension, IP, user-agent, contact. |
| Per page | 25 / others. |
| Summary | "{N} registered devices" + "{X} mobile push · {Y} SIP contact". |
| Table | ACCOUNT · DEVICE ADDRESS · IP · USER AGENT · MAC · DURATION. |
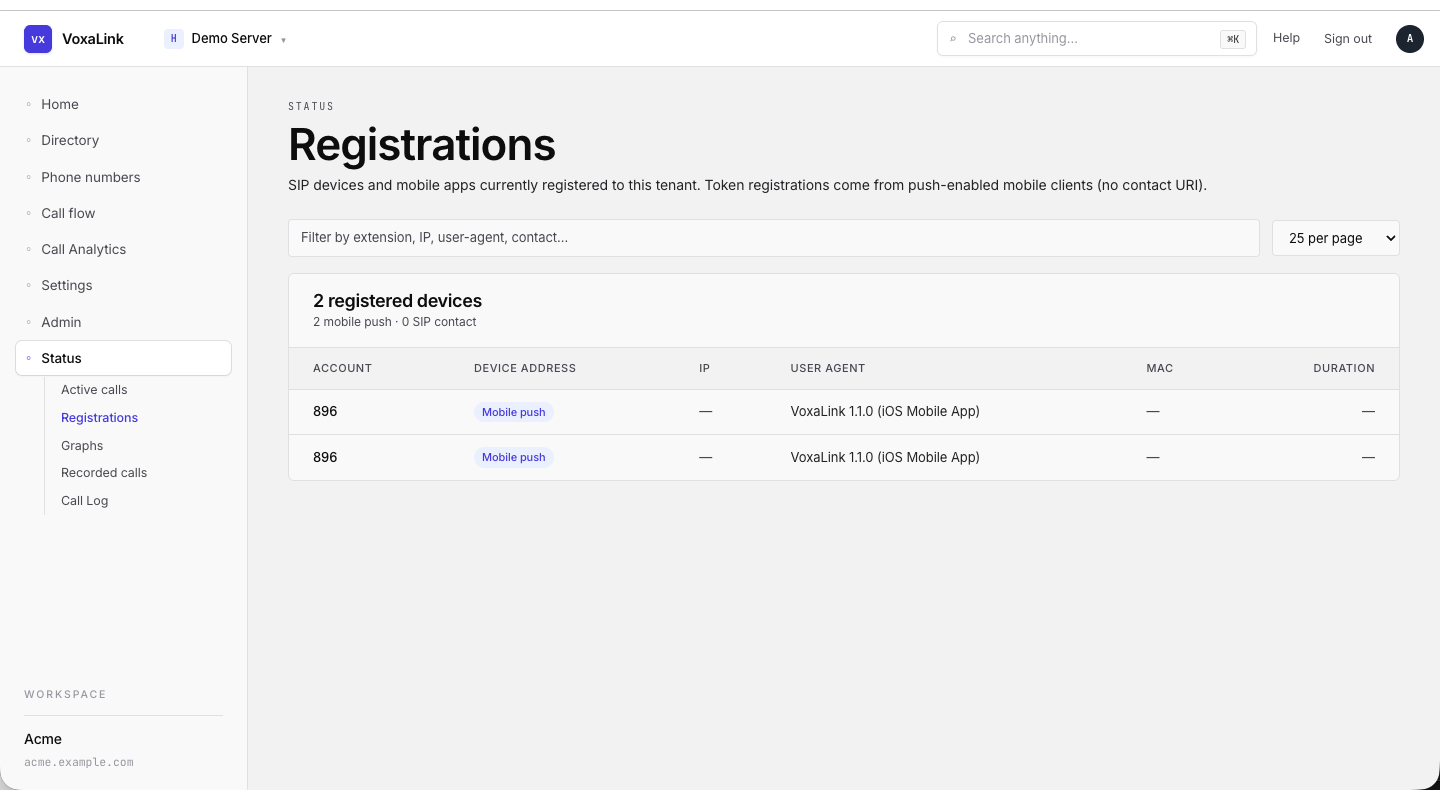 Registrations — two mobile-push entries for ext 896.
Graphs
Twenty-four hour rolling view of call volume, registrations, and call quality. Auto-refreshes every 6 minutes — same cadence Vodia uses upstream.
KPI tiles (four across)
| Tile | What it shows |
|---|---|
| Calls | Current call count, peak in last 24h, and a sparkline. |
| Call legs | Current legs, total in 24h, sparkline. |
| Active registrations | Current registration count and 24h average. |
| Reg changes | Net change with "added · removed (1h)". |
Charts
| Chart | What it shows |
|---|---|
| Call volume | Concurrent calls (blue) layered with call legs (pink), 24h, 10-min buckets. |
Additional charts (registrations and quality) appear lower on the page. The header has an "Updated just now · Refresh every 6 min" label.
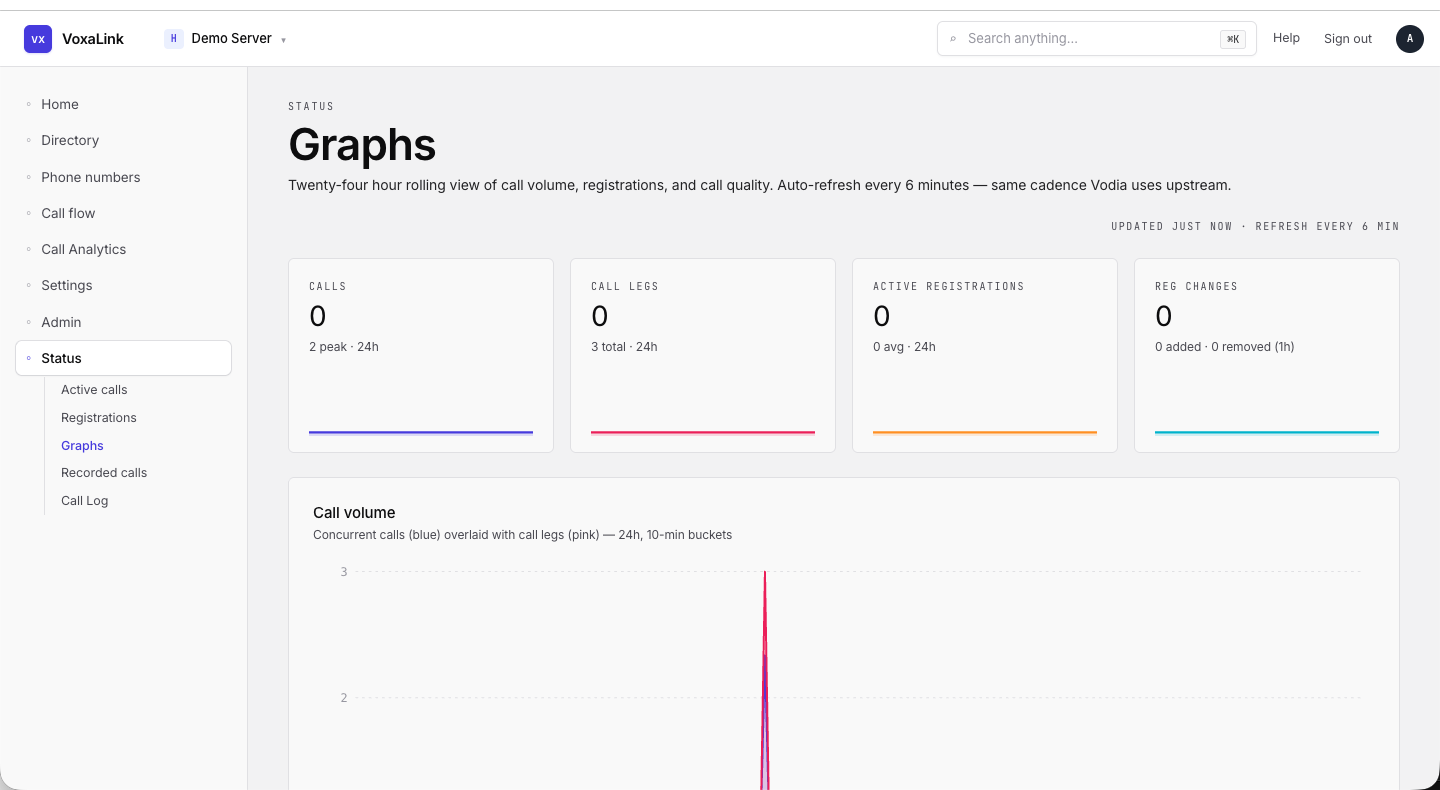 Graphs — four KPI tiles with sparklines, Call volume chart below.
Recorded calls
Every call you've kept the audio for. Click a row to play it back, read the transcript, or add a note. Recordings older than the tenant's retention window are removed nightly.
Toolbar
| Element | What it does |
|---|---|
| Range | All time / Today / Yesterday / Last N days / Custom. |
| Direction | Any / Inbound / Outbound. |
| Search | Caller, extension, call id. |
| Count | "{N} calls". |
Table
Date groups break up the list (e.g., "MONDAY, MAY 25").
| Column | What it shows |
|---|---|
| Selection | Tick to add to a bulk action. |
| Time | hh:mm AM/PM. |
| Caller | Direction-arrow icon + display name + extension. |
| Recipient | The other party. |
| Owner | Which extension owns the recording (e.g., Ext 896). |
| Length | mm:ss. |
| → | Open the playback drawer. |
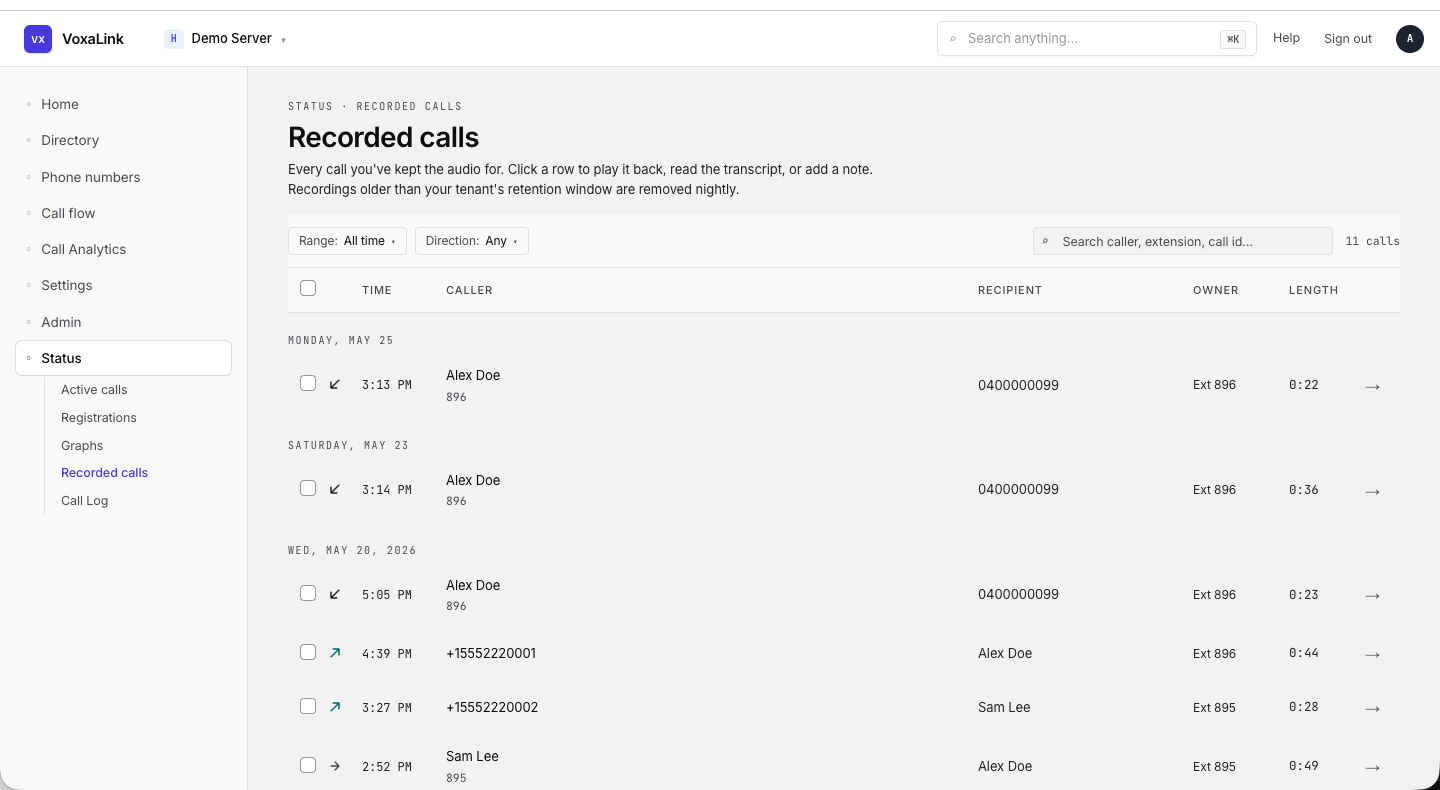 Recorded calls — date groups visible, multiple rows with caller / recipient / owner.
Call Log
Every call placed on this tenant, newest first. Click a row for the per-call timeline, trunk leg, agent legs, and recording.
Header
| Element | What it shows |
|---|---|
| Title | Call log. |
| Subtitle | The line above. |
| Recent calls section | "Showing {visible} of {total} total". |
Table (date-grouped)
| Column | What it shows |
|---|---|
| Time | hh:mm:ss AM/PM. |
| From | Display name with (ext) or raw number. |
| To | Same shape. |
| Duration | mm:ss. |
| Trunks | The trunk name (e.g., SIP Trunk) or —. |
| PCAP | Whether a packet capture is available. |
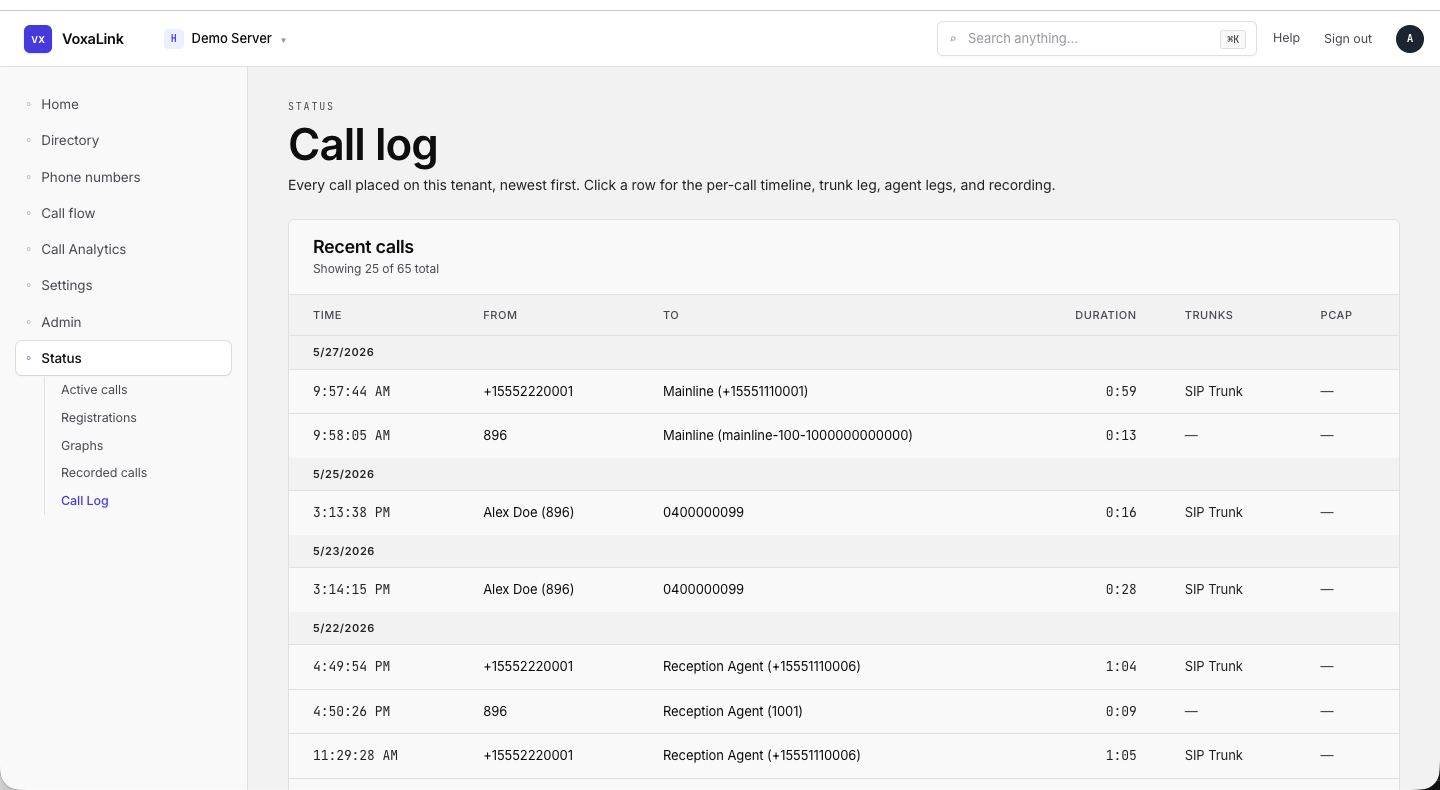 Call log — date groups 5/27 and 5/25 with five rows visible.