Home
Reference material for home.
/portal
The Home page is the AI-summarised dashboard. It opens with a time-of-day greeting (Good morning / Good afternoon / Good evening) and a single sentence describing the selected window.
View toggle
| Toggle | What it does |
|---|---|
| Calm | Lean dashboard — weekly summary, three KPI cards, calls chart, live tile, busiest extension, pipeline, recent recordings, recent calls. Default. |
| Full | Adds extra panels for deeper analytics. |
Range selector
| Option | What it covers |
|---|---|
| Today | The current day. |
| 7 days | The last seven days. Default. |
| 30 days | The last thirty days. |
Header actions
| Button | What it does |
|---|---|
| Export | Downloads the current window as a CSV. |
| AI Briefing | Generates a fuller AI-written narrative briefing of the period (uses your tenant's connected LLM). |
Weekly Summary card
A short AI-written sentence at the top of the dashboard summarising the window — e.g., "16 calls, 75% answered, no abandoned calls. 2 missed inbound calls this week — worth a follow-up." The card shows a "Generated just now" / relative timestamp on the right.
KPI cards (three across)
| Card | What it shows |
|---|---|
| Calls | Total call count, change vs. previous period, and a breakdown line such as "7 inbound · 4 outbound · 5 internal". |
| Answered | Answer rate (e.g. 75%), "X of Y picked up", and a missed/abandoned line. |
| Avg talk time | Average talk time, total talk time for the period, and recordings captured count. |
Calls per day chart
A bar chart of answered (blue) and missed (red) calls for the period. Axis ticks show day-of-week and day-of-month.
Live (right column)
| Element | What it shows |
|---|---|
| Active calls count | Live counter that auto-refreshes. |
| Idle indicator | A small dot — solid when no calls are in progress. |
| Hint line | "No one is on the line" or "{N} on the line". |
Busiest extension (right column)
A profile card for the busiest extension of the period:
| Field | What it shows |
|---|---|
| Avatar + name + extension | The person. |
| Period count | Total calls (large number). |
| Inbound | Inbound count. |
| Outbound | Outbound count. |
| Talk time | Total talk time. |
| Avg MOS | Average call quality across this person's calls. |
| View all extensions → | Jumps to the Top Extensions list. |
Pipeline (right column)
Health summary of the data pipelines that feed the dashboard.
| Row | Healthy means |
|---|---|
| Transcription queue | Empty or short. |
| Transcription pipeline | Running normally. |
| Call records | Recent calls are landing in the CDR store. |
| Recordings storage | The recordings bucket was verified recently. |
A coloured dot per row signals state — green/empty/healthy, amber/quiet, red/degraded. The card header (e.g., "Some systems degraded") summarises the worst row.
Worth a listen
A short list of recently recorded calls surfaced by sentiment, MOS, and length. Each row shows date, direction, duration, caller → callee, sentiment chip (positive / neutral / negative), and Play + Transcript buttons. View all → jumps to Recorded calls.
All calls (bottom)
The most recent calls on the tenant for the selected range. Columns: WHEN, FROM → TO, DIRECTION, STATUS, DURATION, MOS. View all calls → jumps to Call Analytics.
Dashboard failure mode
If the underlying call data sources are offline, the whole page collapses into a single Dashboard unavailable card.
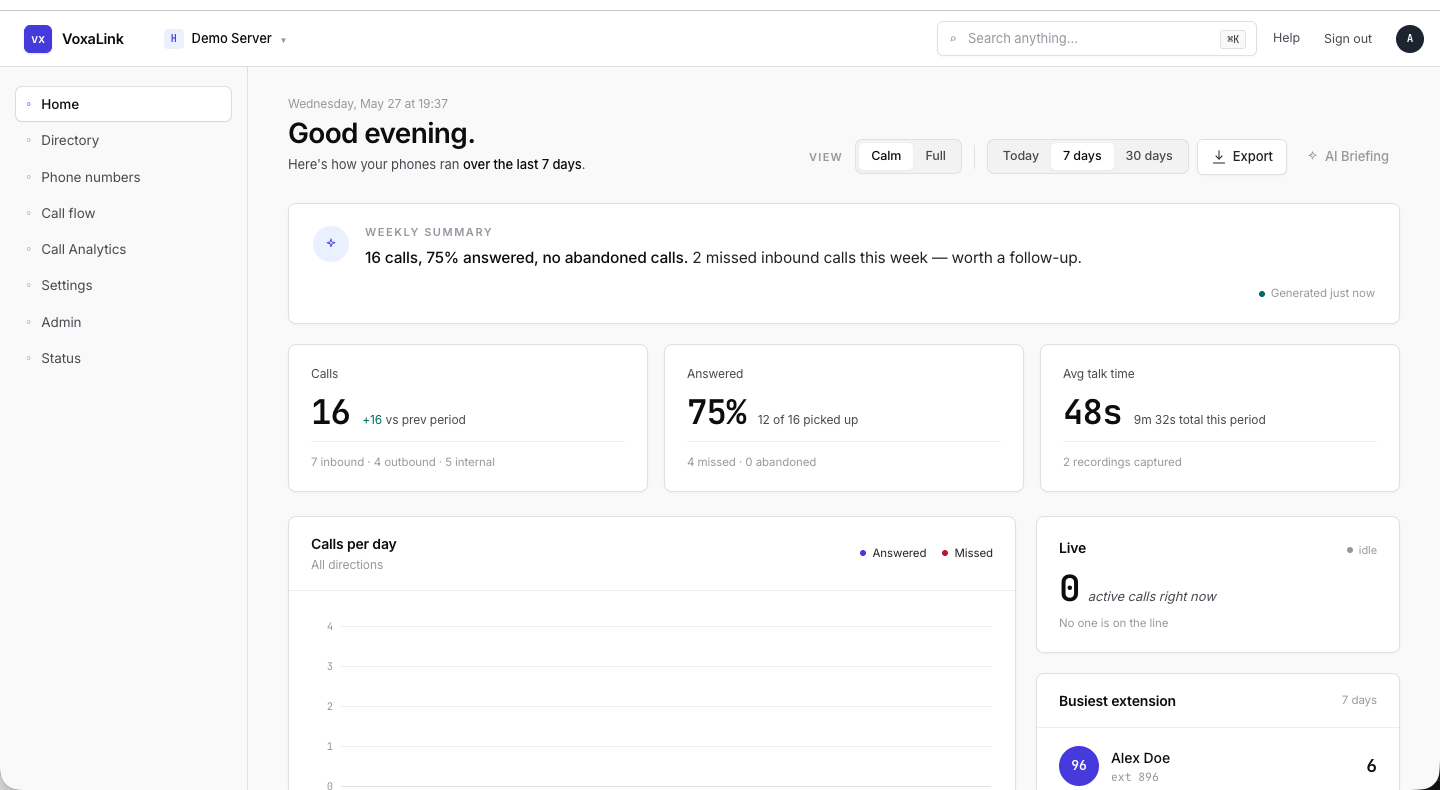 Home — 7 days range, top half (weekly summary, KPIs, calls per day, live, busiest extension).
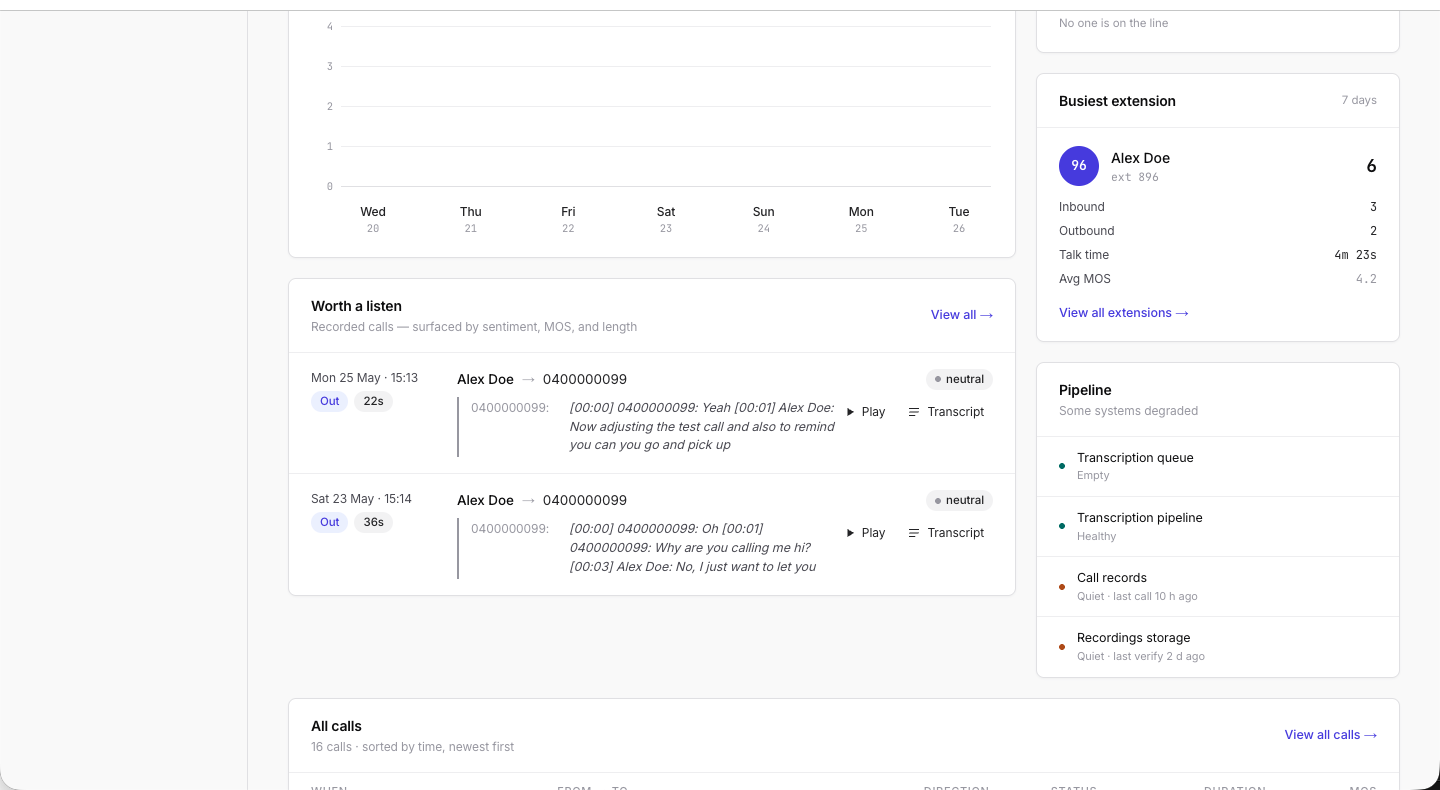 Home — bottom half (Worth a listen, Pipeline, All calls table).